Metrics
In addition to the reports and charts built in to the Supabase dashboard, each project hosted on the Supabase platform comes with a Prometheus-compatible metrics endpoint, which can be used to gather insight into the health and status of your project.
You can use this endpoint to ingest data into your own monitoring and alerting infrastructure, as long as it is capable of scraping Prometheus-compatible endpoints, in order to set up custom rules beyond those supported by the Supabase dashboard.
The endpoint discussed in this article is in beta, and the metrics returned by it might evolve or be changed in the future to increase its utility.
The endpoint discussed in this article is not available on self-hosted.
Accessing the metrics endpoint
Your project's metrics endpoint is accessible at https://<project-ref>.supabase.co/customer/v1/privileged/metrics. Access to the endpoint is secured via HTTP Basic Auth; the username is service_role, while the password is the service role JWT available through the Supabase dashboard.
_10> curl https://<project-ref>.supabase.co/customer/v1/privileged/metrics --user 'service_role:<service-role-jwt>'
Configuring Prometheus
For self-hosted Prometheus, modify your prometheus.yaml file to add a Supabase job, and set the metrics_path, scheme, basic_auth and targets parameters. For example:
_13scrape_configs:_13 - job_name: "MyJob"_13 metrics_path: "/customer/v1/privileged/metrics"_13 scheme: https_13 basic_auth:_13 username: "service_role"_13 password: "<your service_role JWT>"_13 static_configs:_13 - targets: [_13 "<your Supabase Project ID>.supabase.co:443"_13 ]_13 labels:_13 group: "MyGroupLabel"
Additionally, we maintain a repo for a scraping agent to work with Grafana Cloud.
Deploying Supabase Grafana
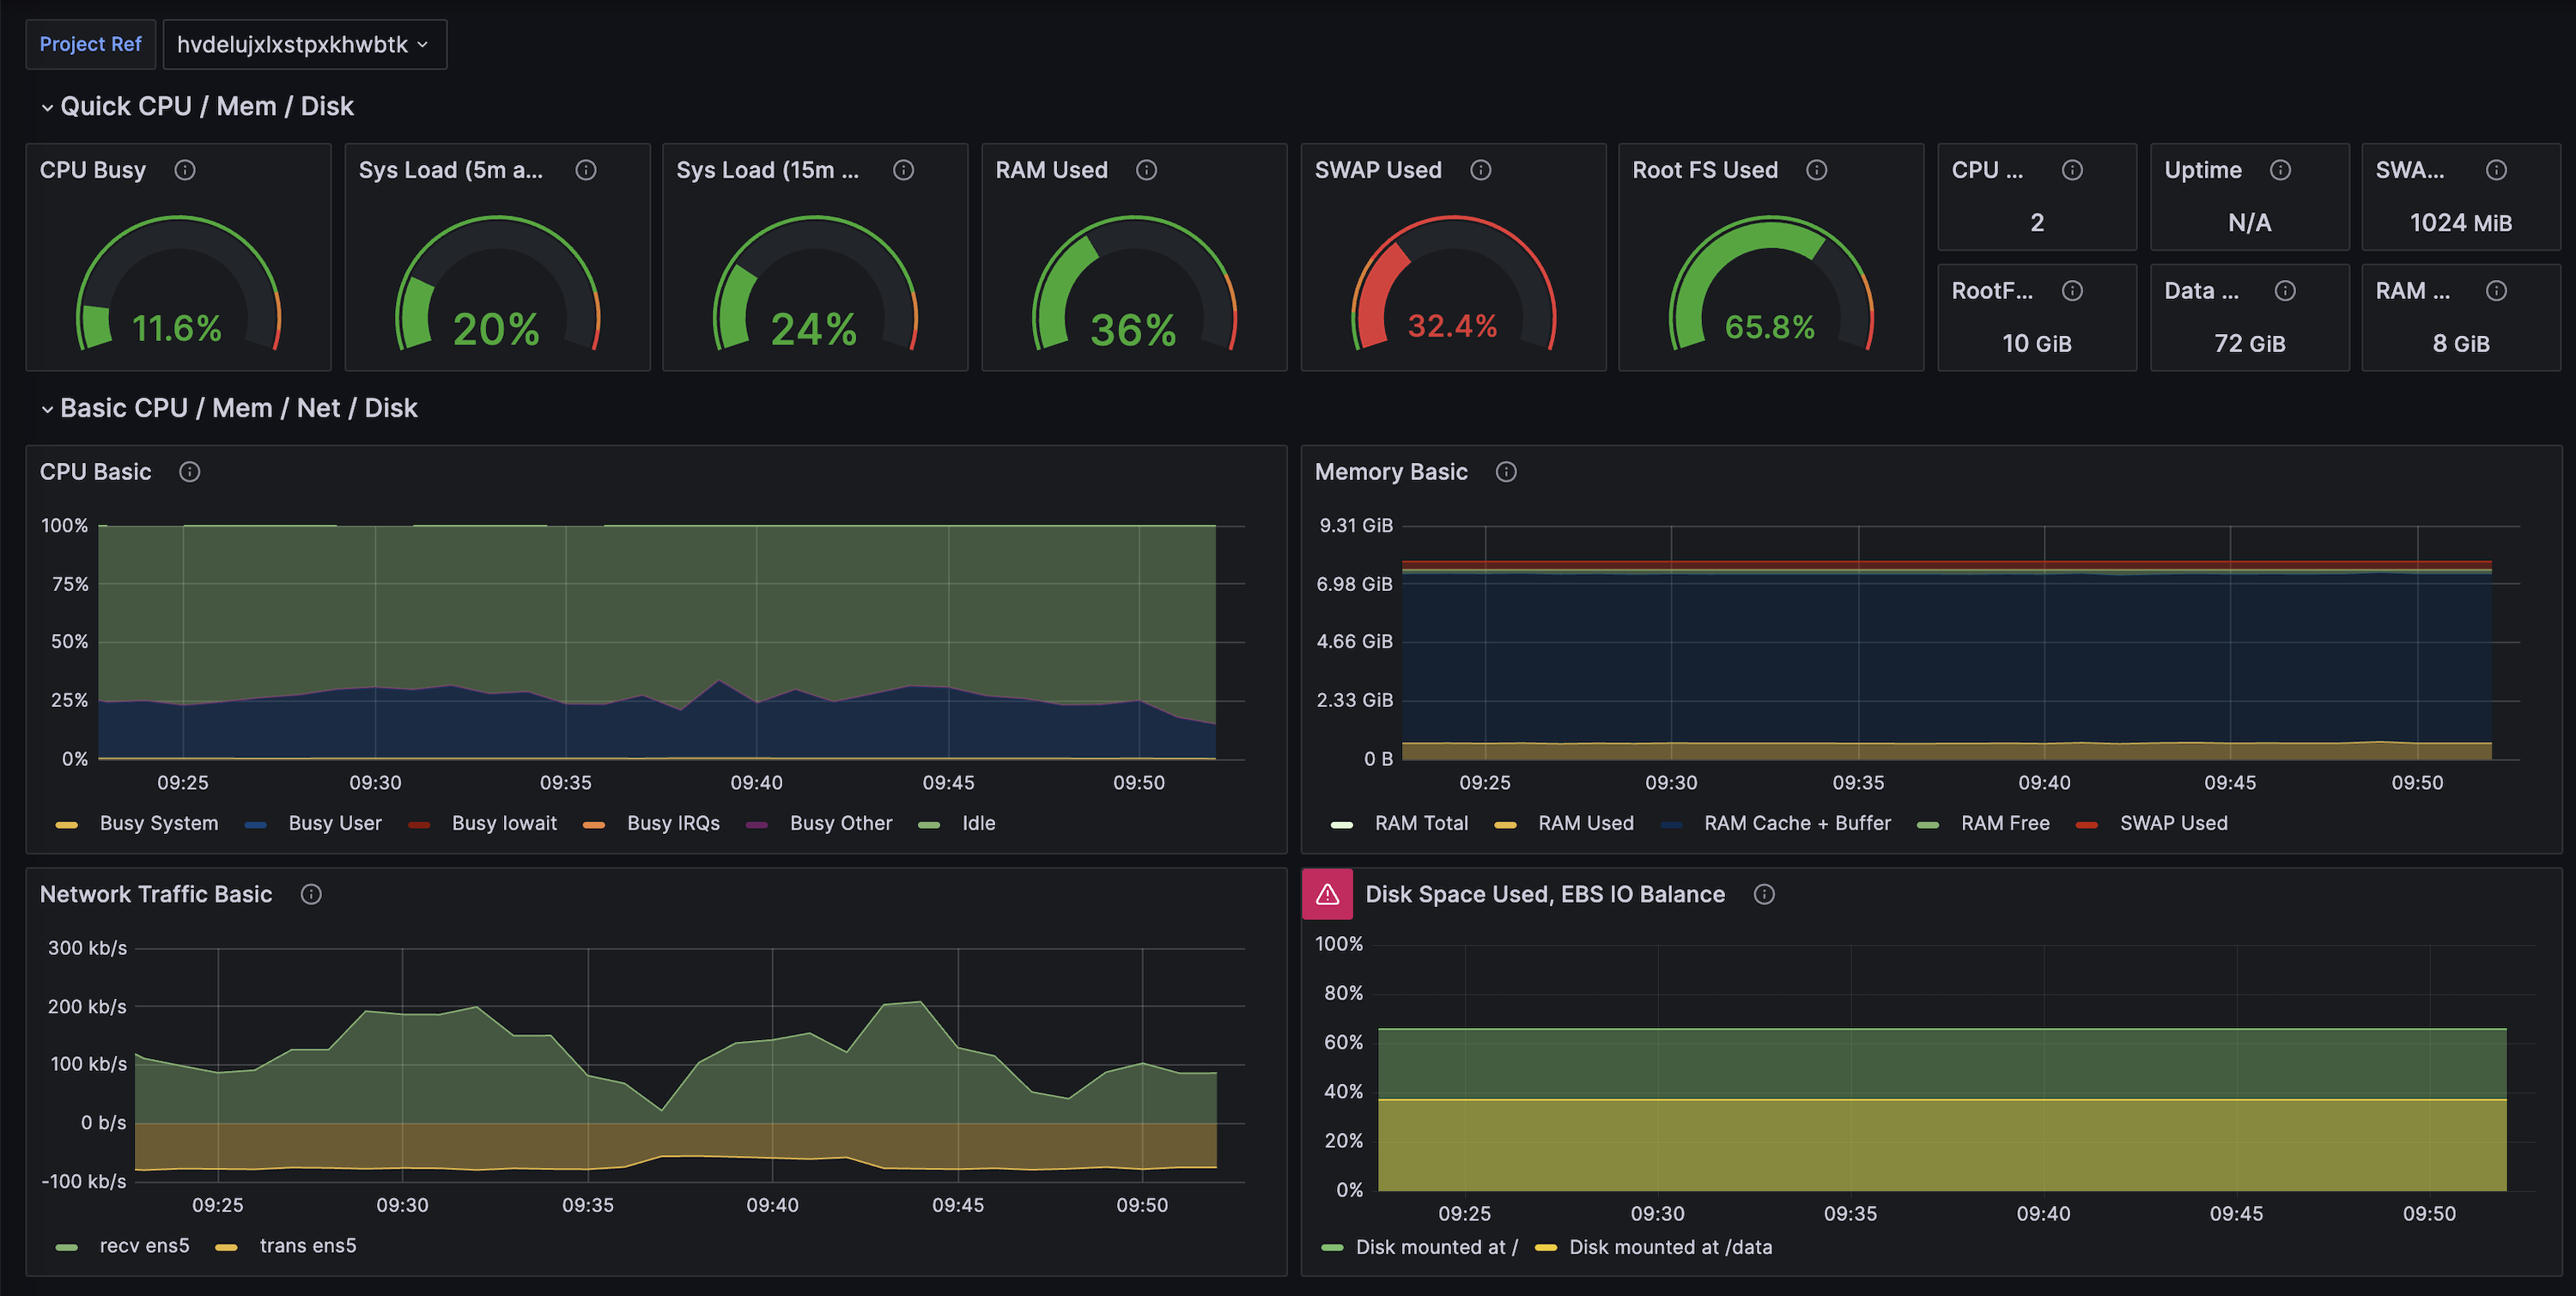
The pre-configured Supabase Grafana Dashboard is an advanced version of the Dashboard's Database Reports. It visualizes over 200 database performance and health metrics and is updated every minute.
Deploying locally
Prerequisites:
- Must have Docker or a Docker compatible runtime on your machine
Supabase Grafana only tracks metrics while it's active. For monitoring historical trends, it's better to use a dedicated server that can record data continuously.
Download the project
Download the code from the Github repo
_10git clone https://github.com/supabase/supabase-grafana.git
Create a .env file
copy the example.env into a new .env
_10cp .env.example .env
Add your credentials
- To monitor a single project, add your service_role key from the API Settings and Reference ID from the General Settings.
- To monitor multiple projects, create an account access token and add it to your
.envfile.
- Add the values to your
.envfile:
Deploy Grafana with Docker
Deploy the server. Once it is active, you can go to localhost:8000/login in the browser
_10docker compose up
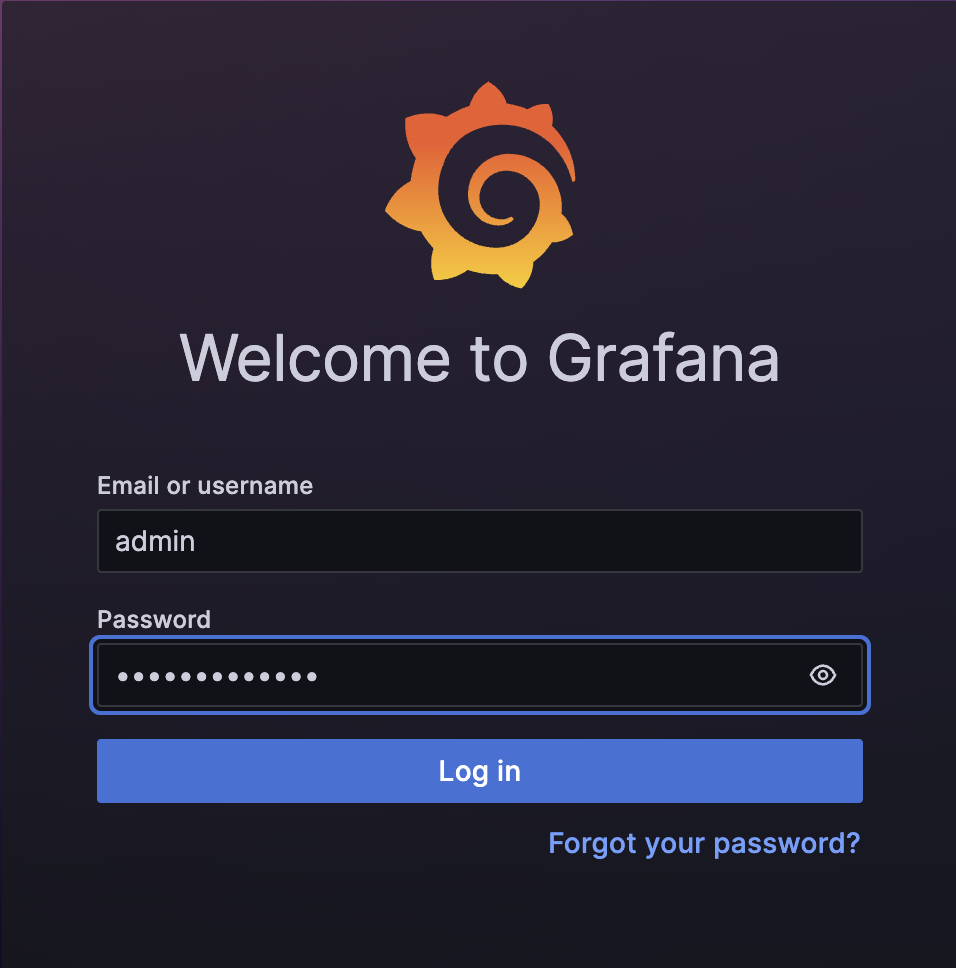
Login
Login with your username (default is admin) and the password you created in step 4.
Deploying to Grafana cloud

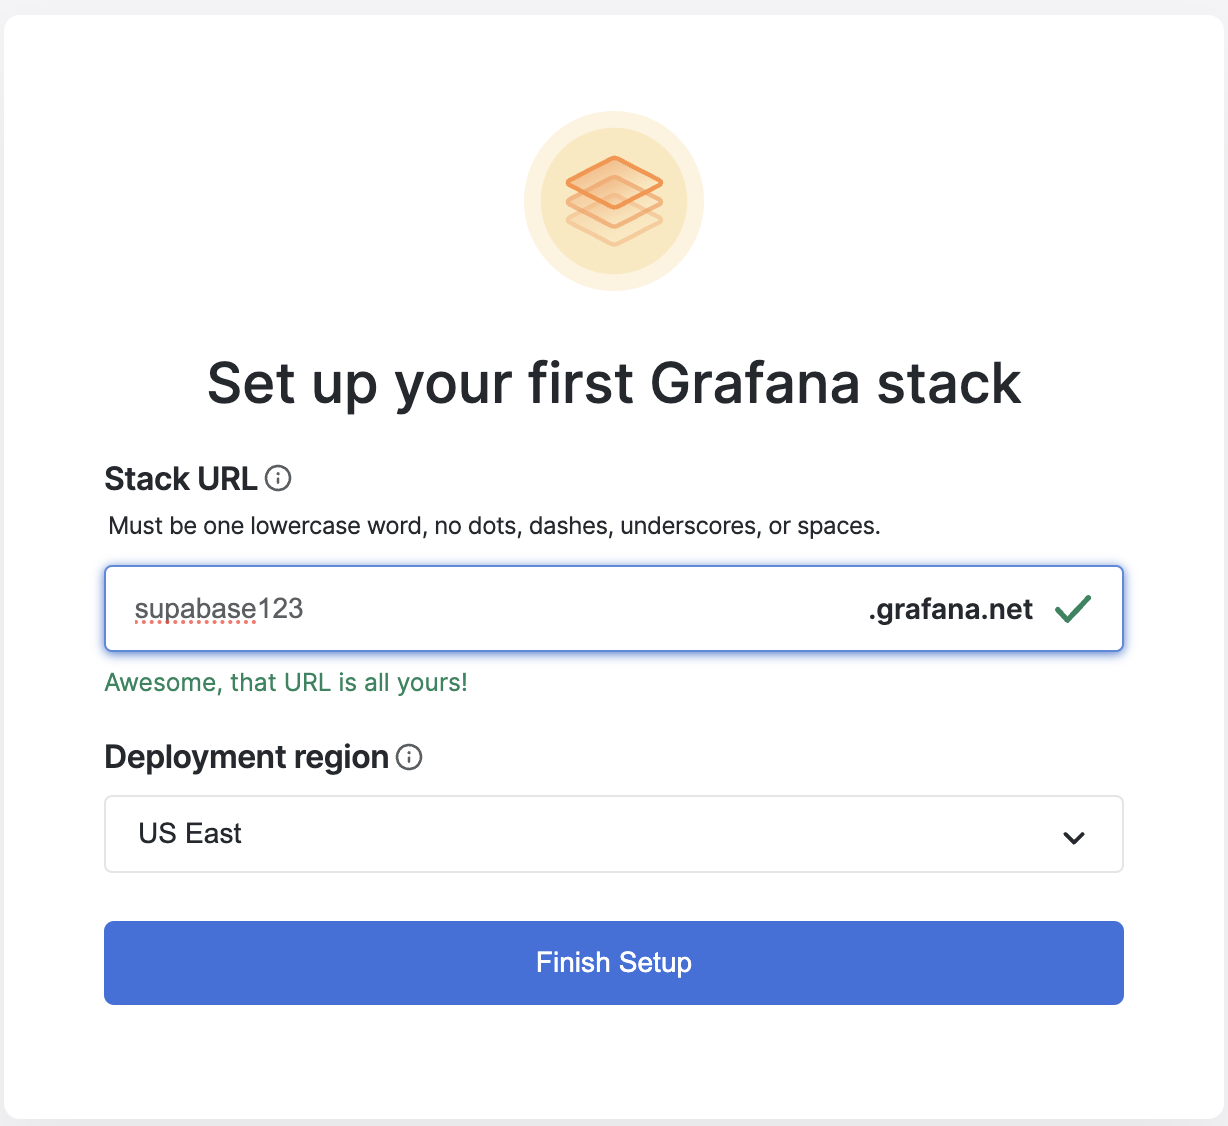
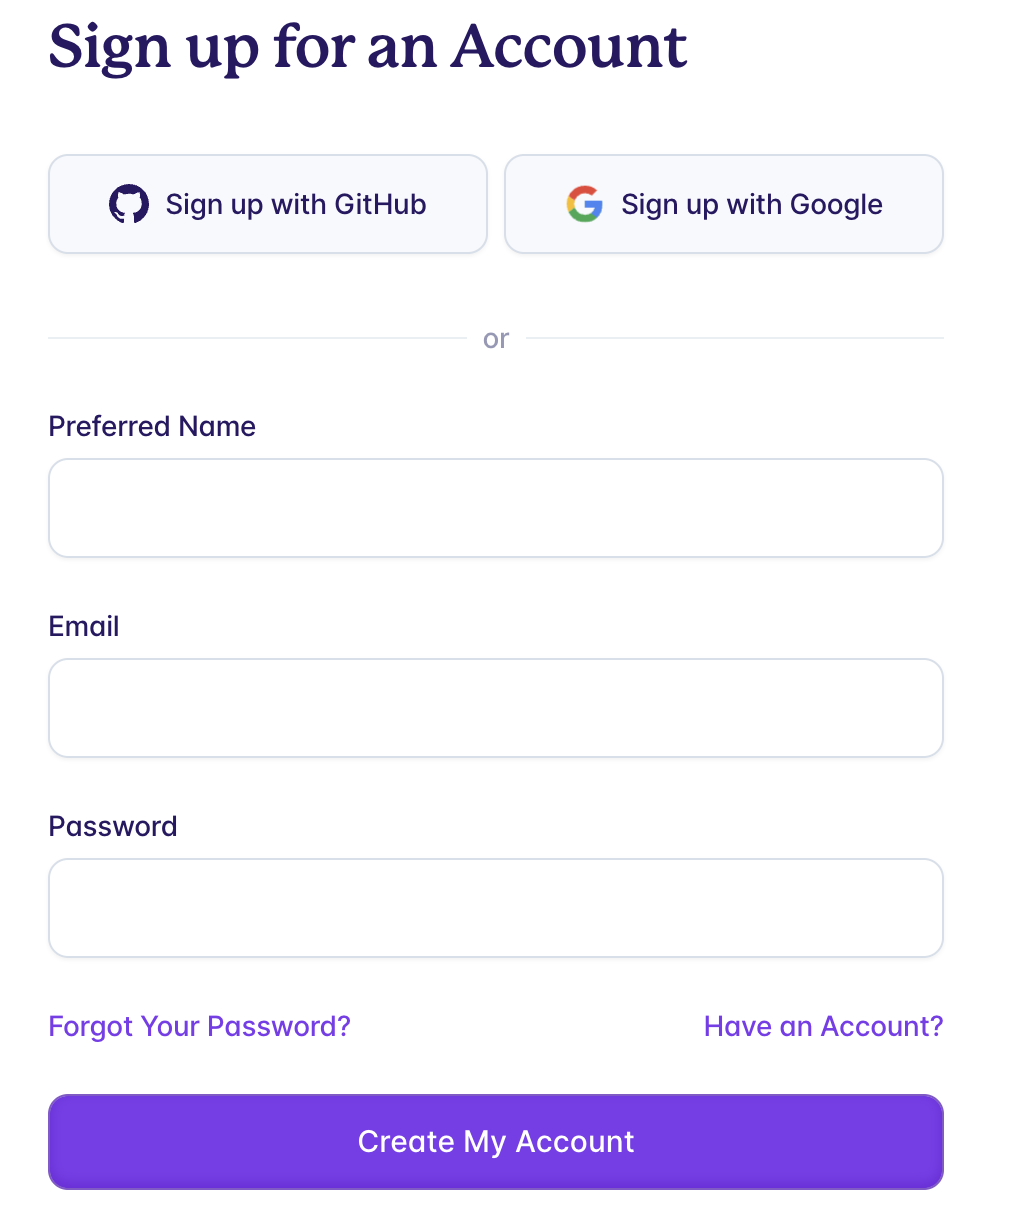
Give a name to your Grafana project
Grafana will prompt you to create a stack. Give it a name and continue.
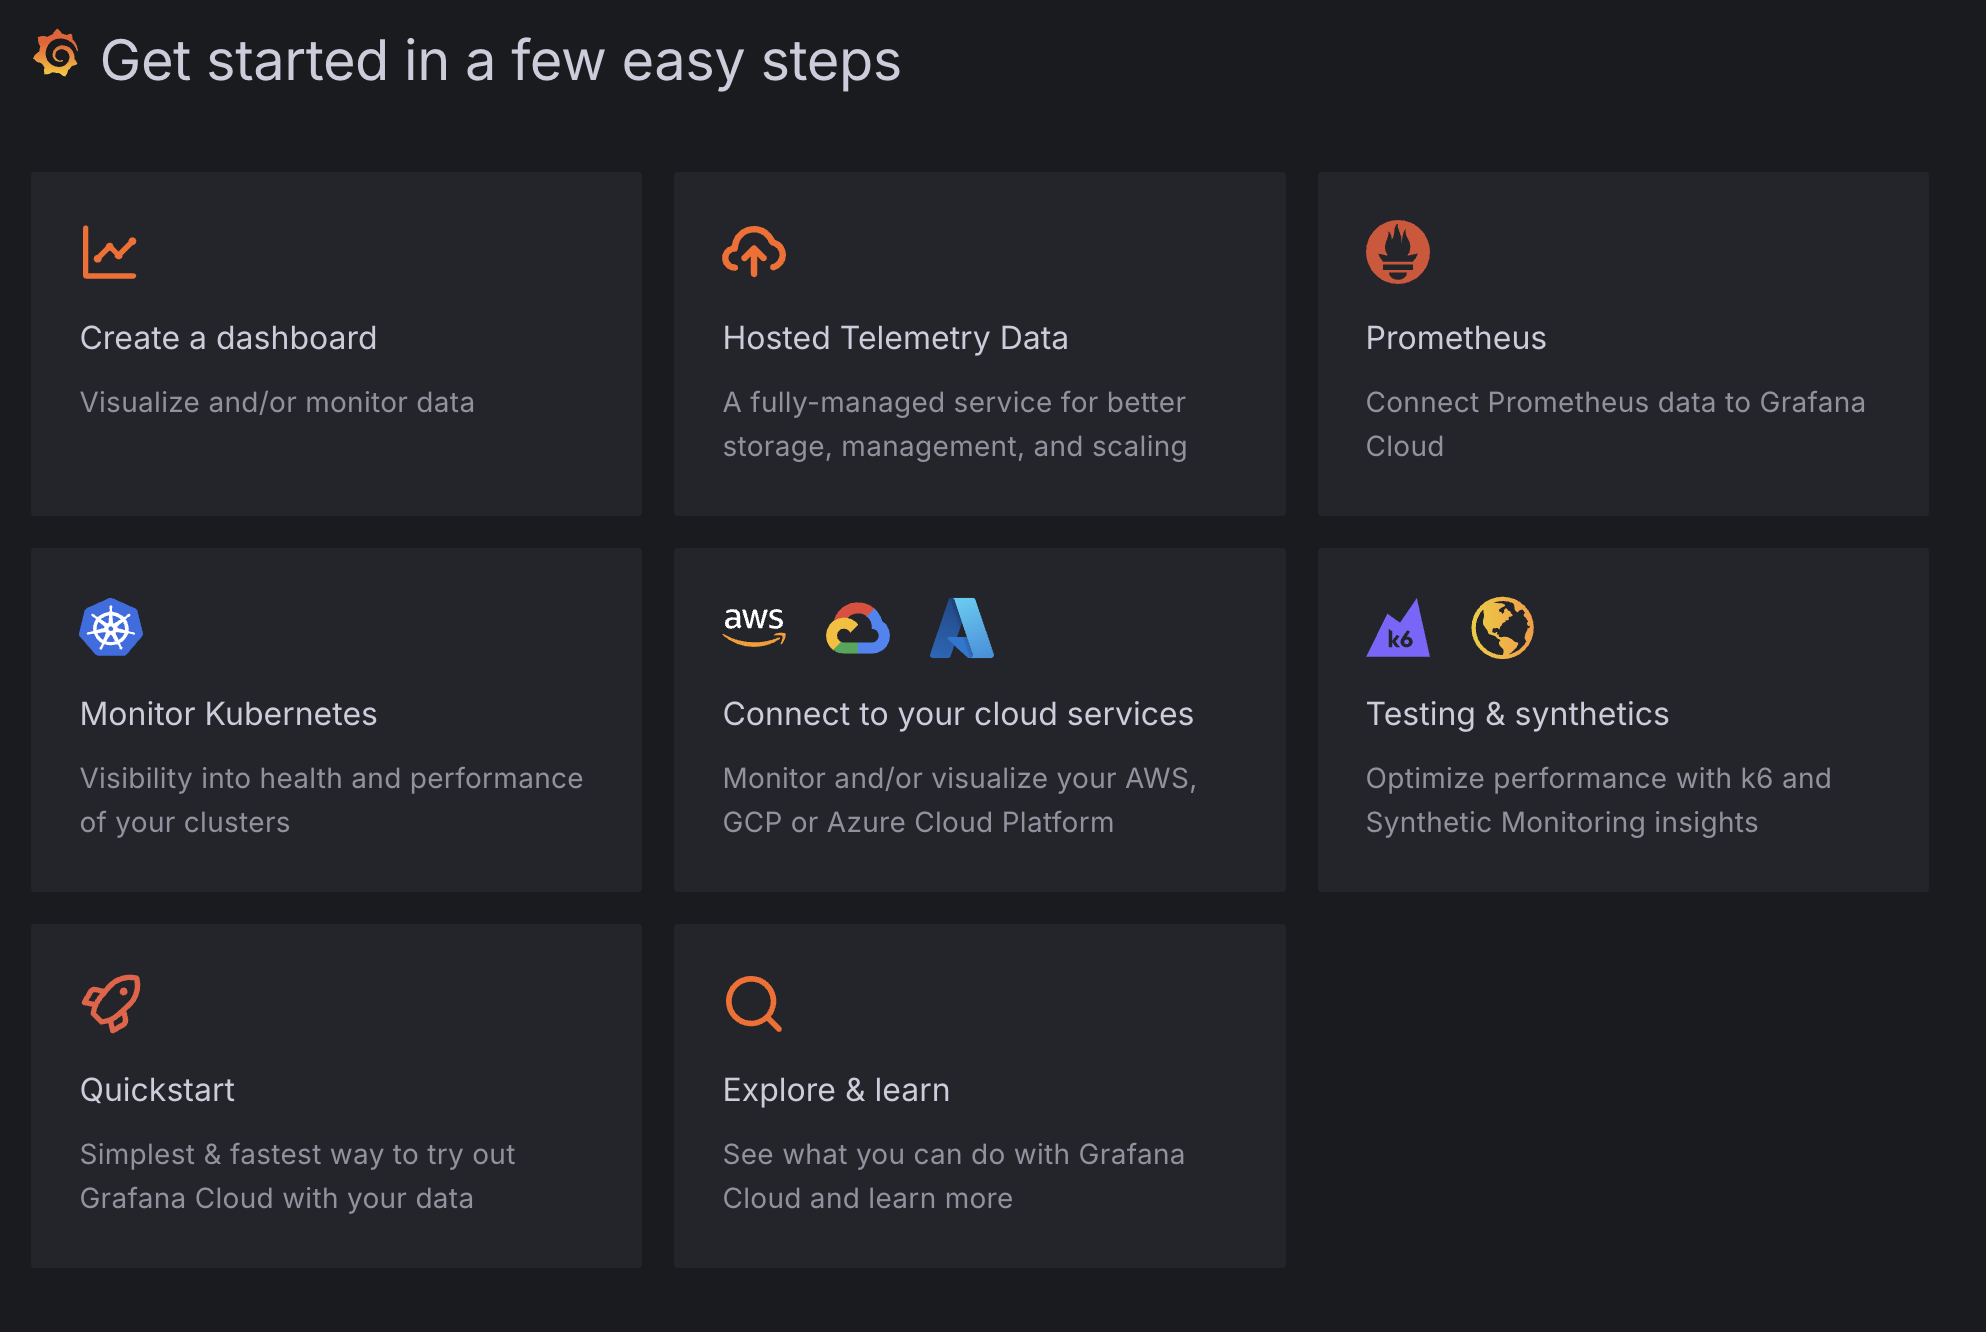
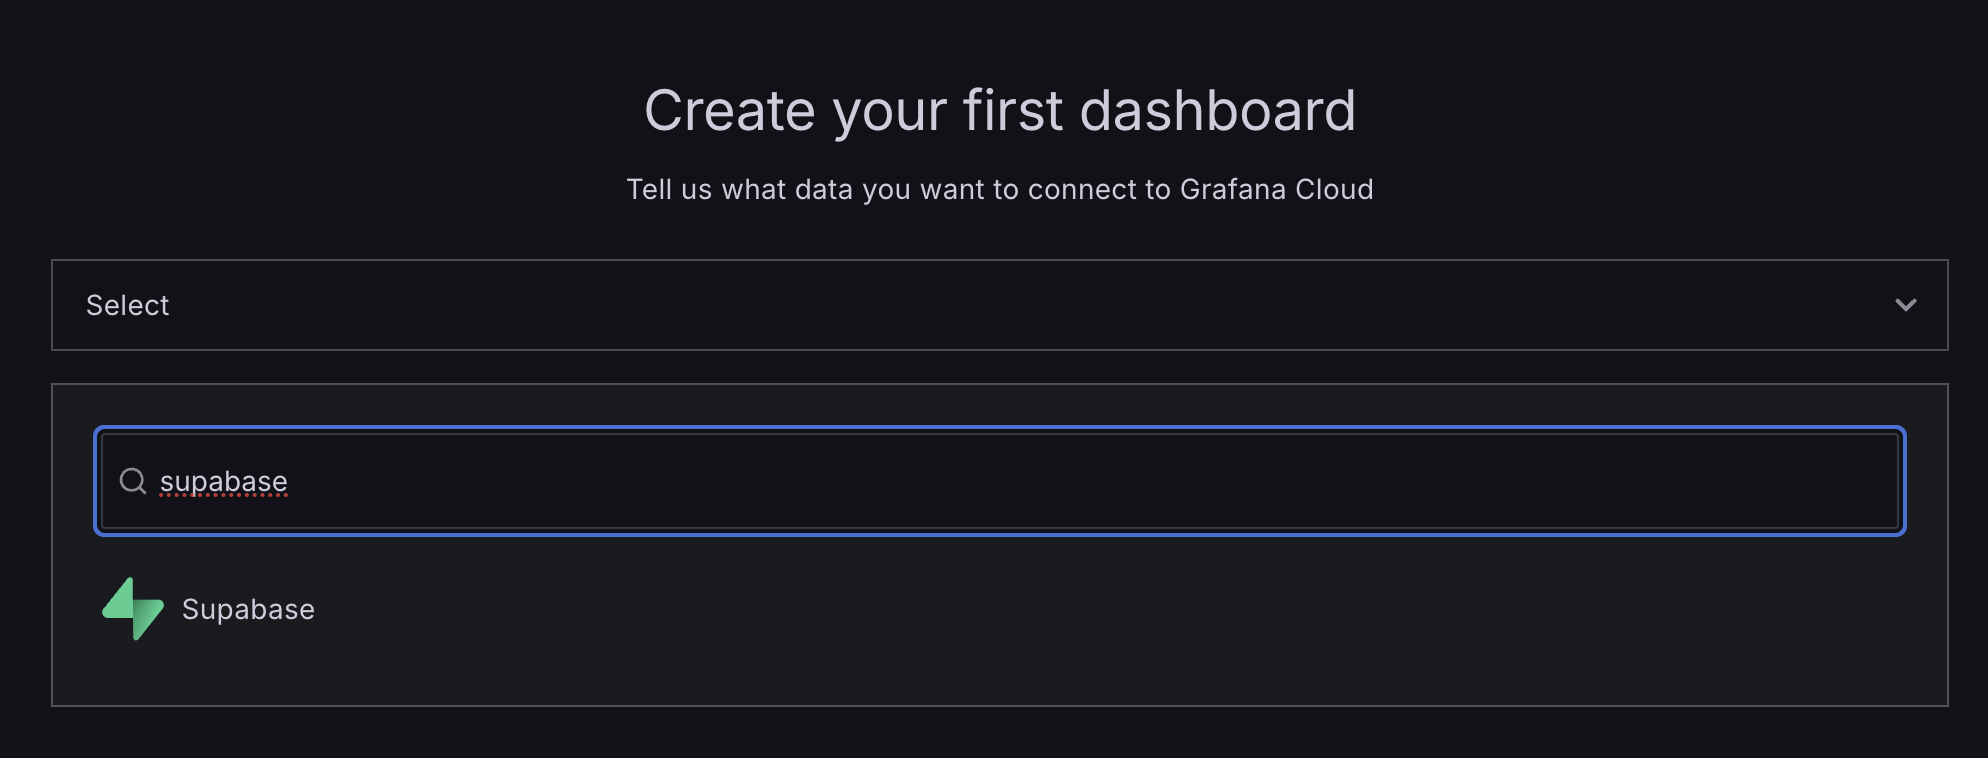
Create a new Grafana Dashboard
Create a new Dashboard
Search for the Supabase template
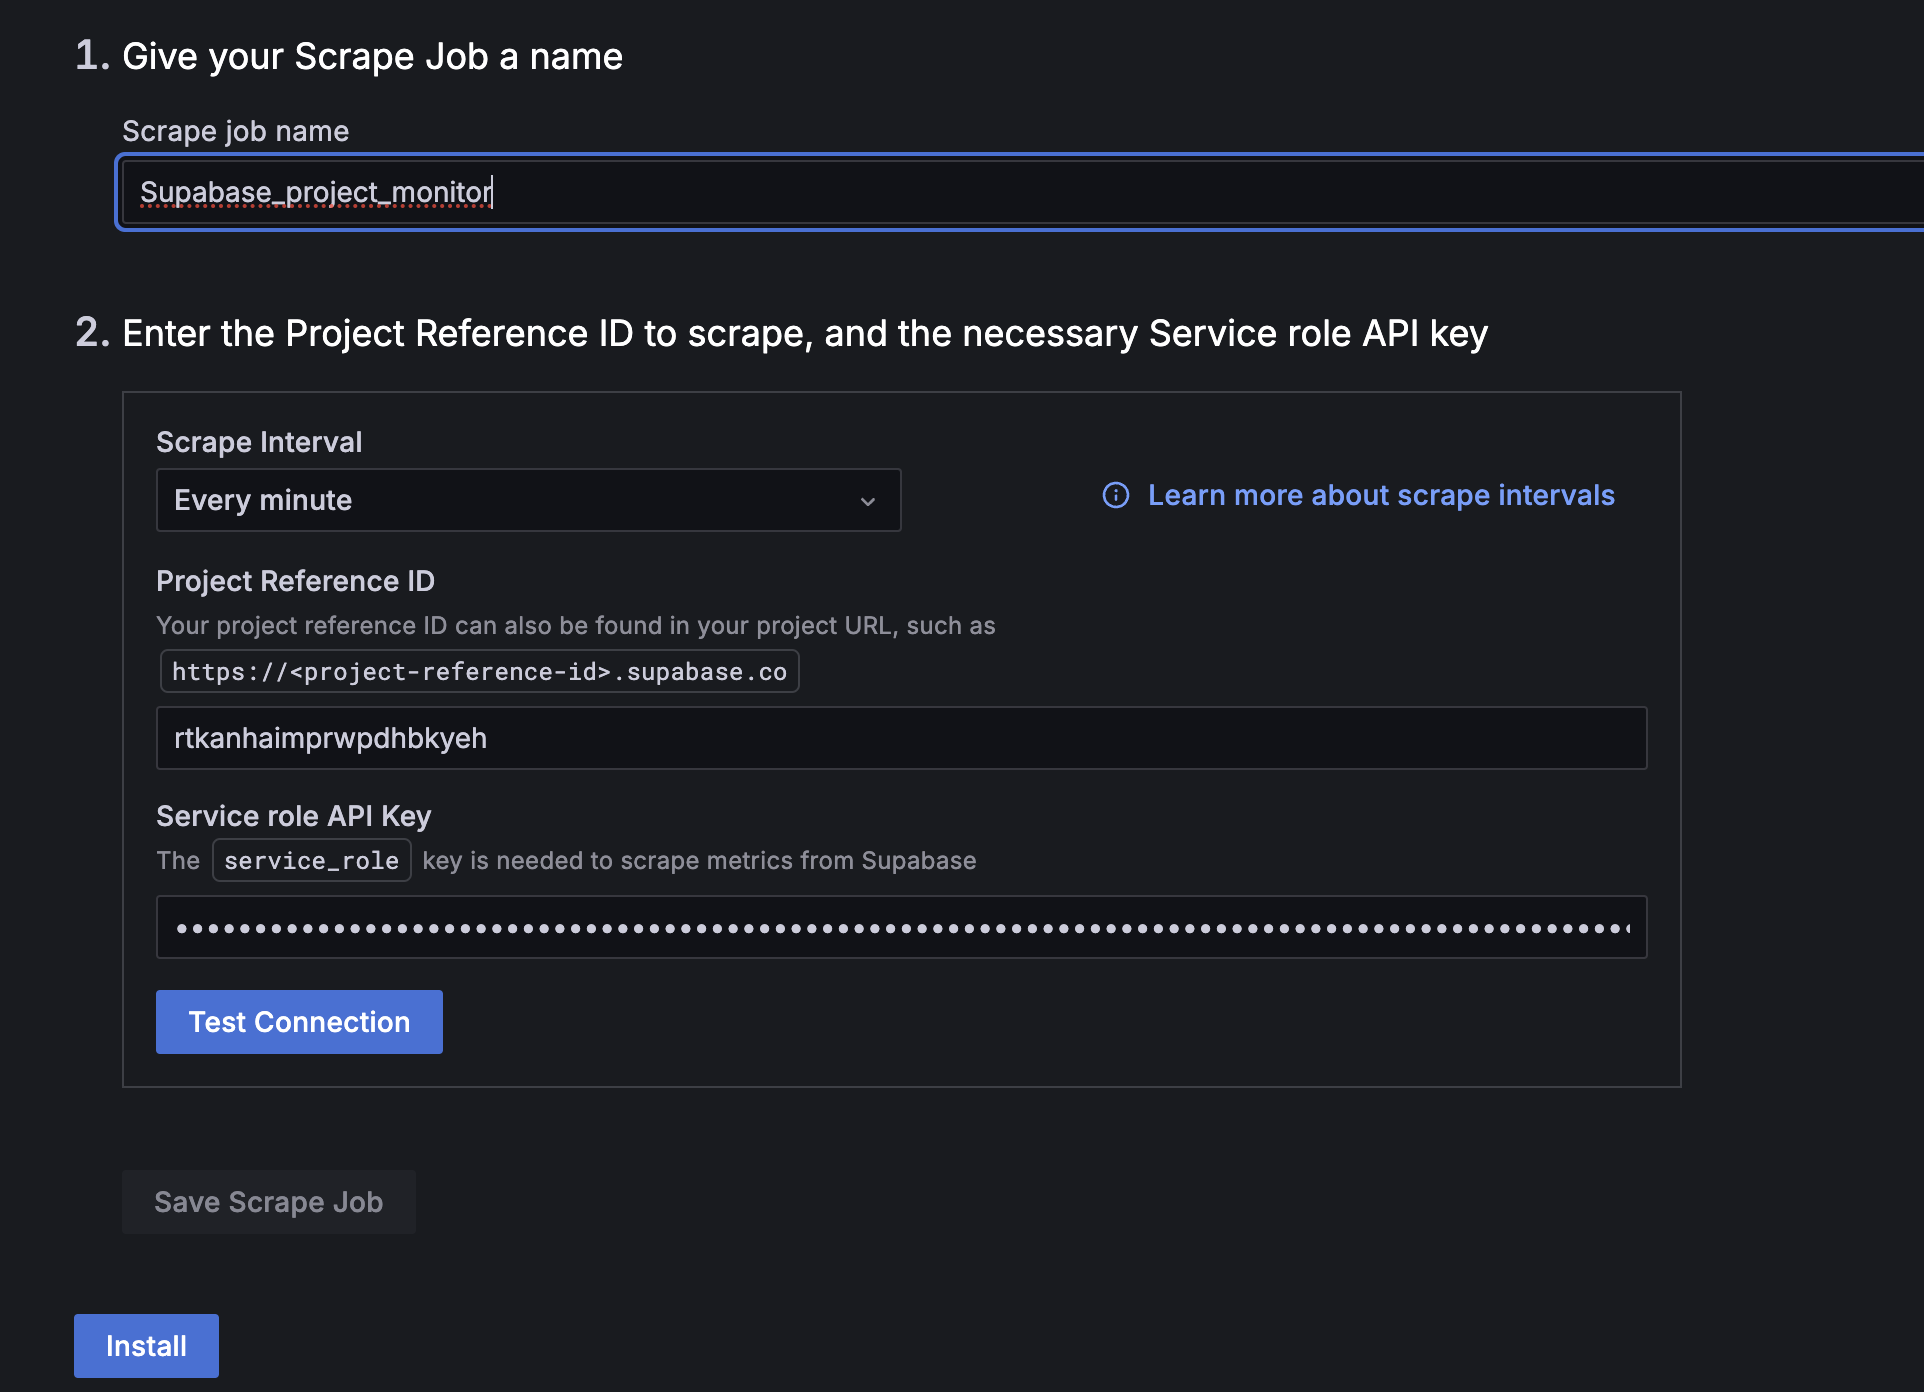
Add your credentials and deploy
Add your service_role key from the API Settings and Reference ID from the General Settings to your Grafana credentials. Then install your dashboard.
Deploying to fly.io
This section explains deploying to Fly.io using the included configuration file, but deployment to other hosts is also possible.
Create a fly.io account
If you do not already have one, create a fly.io account.
Go through the onboarding process, including downloading the Fly CLI tool
Deploy your project
Log into your Fly account through the CLI:
Deploy your project with the Fly CLI
Access your project
- Go to your Fly.io Dashboard and select your project.
- It may take a few minutes for the project to spin up. Once it's ready, click on the project's link to view your Grafana Dashboard.
- When prompted, enter the username admin and the password you created earlier.